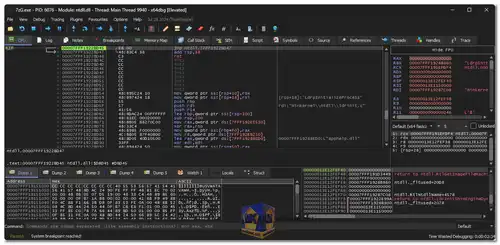
x64dbg is a powerful open-source debugger designed for Windows applications, supporting both x64 and x32 architectures. It’s crafted to cater to both seasoned reverse engineers and those new to the field, offering a user-friendly interface combined with a robust set of features. Built on a foundation of open-source libraries and tools, x64dbg stands out as a highly customizable and extendable debugger, enabling users to tweak their debugging environment to fit their specific needs.
x64dbg Key Features:
- Open-Source: x64dbg is freely available under the GPLv3 license, allowing users to access both the executable and the source code. The community is encouraged to contribute to its ongoing development.
- Intuitive Interface: The debugger features a familiar yet refreshed interface that makes navigation easy, even for those accustomed to other debugging tools.
- C-like Expression Parser: x64dbg includes a powerful C-like expression parser, which simplifies the evaluation of complex expressions during debugging.
- Full-Featured Debugging:
DLL and EXE Support: Debug both DLL and EXE files using the integrated TitanEngine.
Memory Map & Symbol View: Provides comprehensive views of memory allocations and symbol information. - Enhanced Navigation and Visualization:
IDA-like Sidebar and Instruction Highlighting: An IDA-like sidebar with jump arrows and token highlighters makes code navigation straightforward, with visual cues to highlight registers and other instructions.
Graph View: Visualize code flow with an integrated graph view, making it easier to understand complex code structures. - Advanced Views:
Thread and Source Code Views: Examine active threads and source code simultaneously, enhancing your ability to track down issues.
Content-Sensitive Register View: Registers are displayed contextually, showing their relevance based on the current code. - Customization:
Color Schemes: Fully customizable color schemes allow you to tailor the interface to your preferences.
User Database: Store comments, labels, bookmarks, and more in a user database (JSON format), ensuring that your customizations are persistent across sessions. - Powerful Disassembly and Analysis:
Fast Disassembler (Zydis): Quickly disassemble code for analysis.
Built-in Assembler: Use XEDParse and asmjit for inline assembly and patching executable files directly within x64dbg. - Automation and Scripting:
Scriptable Environment: The integrated ASM-like scripting language is extendable and debuggable, allowing you to automate repetitive tasks and enhance functionality.
Plugin Support: A growing API enables the development of plugins, extending x64dbg’s capabilities to meet specific needs. - Additional Functionalities:
Multi-Datatype Memory Dump: Examine memory in various formats.
Dynamic Stack View: Real-time viewing of the stack during debugging.
Executable Patching: Modify executables directly within the debugger.
Scylla Integration: Includes an import reconstructor for recovering imports.
Active Development & Community Engagement: x64dbg is constantly evolving, with active contributions from the reverse engineering community. The tool is community-aware, with many features inspired by or directly contributed by users. Its design ensures that it remains relevant and powerful, adapting to the ever-changing landscape of software development and debugging.
Built on Open-Source Libraries: The power of x64dbg is amplified by its reliance on a variety of open-source libraries and tools, including Qt for the interface, TitanEngine for debugging, Zydis for disassembly, and several others like Yara, Scylla, Jansson, lz4, XEDParse, asmjit, and Snowman.
Whether you're a professional reverse engineer or a newcomer, x64dbg offers a comprehensive, customizable, and community-driven toolset for debugging on Windows. With its active development and rich feature set, it remains one of the most powerful debuggers available for Windows platforms.
How to use x64dbg:
A Beginner's Guide to x64dbg:
- Download and Install x64dbg: Download x64dbg from the link below.
- Open a File: Launch x64dbg. Click on "File" -> "Open" and select the executable file you want to debug.
- Basic Navigation:
Disassembly Window: This shows the disassembled code of the executable.
Registers Window: Displays the current values of various CPU registers.
Memory Window: Allows you to inspect and modify memory.
Stack Window: Shows the current state of the stack. - Setting Breakpoints:
Breakpoints are points in the code where the debugger pauses execution.
Right-click on a line in the disassembly window and select "Breakpoint" -> "Toggle". A red dot will appear next to the line.
When you run the program, it will pause at the breakpoint. - Stepping Through Code:
Step Into: Goes into the function called at the current instruction.
Step Over: Executes the current instruction and steps to the next one, even if it's a function call.
Step Out: Executes the remaining instructions in the current function and returns to the caller. - Inspecting Variables and Memory:
Memory Window: Use this to examine and modify memory locations.
Watch Window: Add expressions (e.g., variables, memory addresses) to monitor their values. - Debugging Techniques:
Single-Stepping: Execute the code one instruction at a time.
Breakpoints: Pause execution at specific points.
Watchpoints: Break when a memory location or register changes.
Memory Dumps: Save memory contents to a file. - Plugins and Extensions:
x64dbg has a rich ecosystem of plugins that can enhance its capabilities. Some popular ones include:
Scylla: For advanced memory analysis.
OllyDbg Scripting: Allows scripting for automation.
Example:
- Open a simple C program compiled into an executable.
- Set a breakpoint at the beginning of the main function.
- Run the program (F9).
- Step through the code using F7 (Step Into) or F8 (Step Over).
- Inspect variables and memory using the Watch Window and Memory Window.
Remember: x64dbg offers a wide range of features and can be overwhelming at first. Experiment with different techniques and refer to the documentation for more in-depth explanations.

